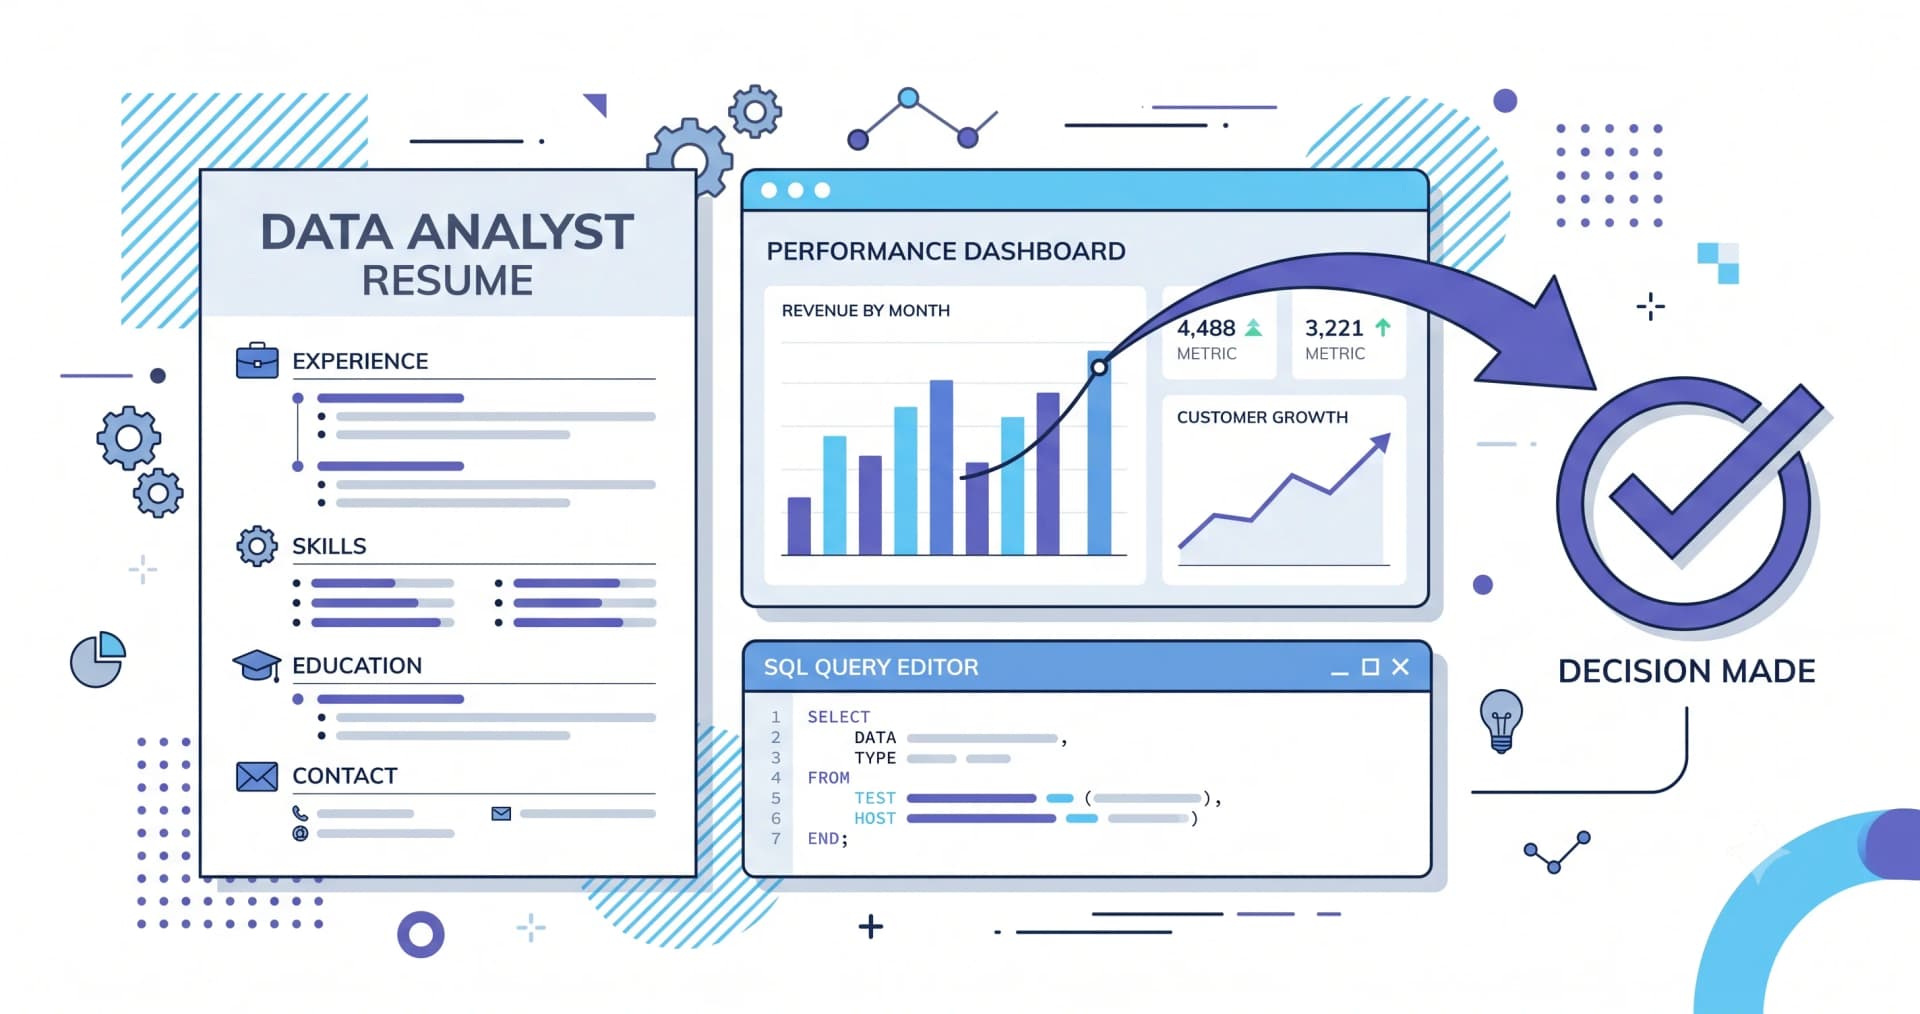
Analyst hiring managers are screening for one thing: did your analysis change a decision? Tool lists are easy to fake and easy to acquire. Decisions influenced are neither.
Lead every bullet with the decision, not the dashboard
Created dashboards in Power BI for the sales team using data from SQL Server.
Built the regional sales dashboard used in the weekly review; surfaced a 3-week lag in the South zone pipeline that led to reallocating 4 field reps and a 12% quarter-on-quarter recovery.
The stack, in the order employers ask for it
- SQL — non-negotiable; say what level (window functions, CTEs, query tuning)
- Excel — still the most-used tool in Indian analytics teams; name the advanced parts
- A BI tool — Power BI, Tableau or Looker; one done well beats three listed
- Python or R — pandas, numpy; only if you genuinely use it
- Warehouse exposure — BigQuery, Snowflake, Redshift
Quantify the data, not just the result
Two numbers make an analyst bullet credible: the size of the data and the size of the outcome. 'Analysed 2.3M transactions across 14 months' tells a reader you've worked beyond a sample spreadsheet.
If you're switching into analytics
Career-changers win on domain plus tooling. A former operations executive who can now write SQL understands the business questions better than a fresh graduate who only knows the tools. Make the domain explicit: 'Six years in retail operations, now analysing the same supply chain in SQL and Power BI.'
Back it with one end-to-end project on real, public data — messy data cleaned, a question answered, a recommendation made.
Certifications worth the line
Google Data Analytics, Microsoft PL-300 and the DataCamp/Coursera tracks all help a career-changer and add little for someone with three years of experience. List them below your projects, never above.
Put this into practice
Build, score and tailor your resume with JotCV — free plan, no card needed.
Match your resume to an analyst JD